Mini-Minecraft
Built a first-person and interactive 3D World from scratch (no game engine) using C++ and the OpenGL pipeline. The game implements the key features of Minecraft as is described below in the expandable tabs. This includes a diverse landscape with different biomes and terrains, artificial intelligence in the non-playable characters, inventory/crafting systems, and much more. The final product included over 30 pairs of C++ header and source files as well as over a dozen glsl vertex and fragment shader files with over 10,000 total lines of written code.
Procedural Terrain / Cave Systems / Objects
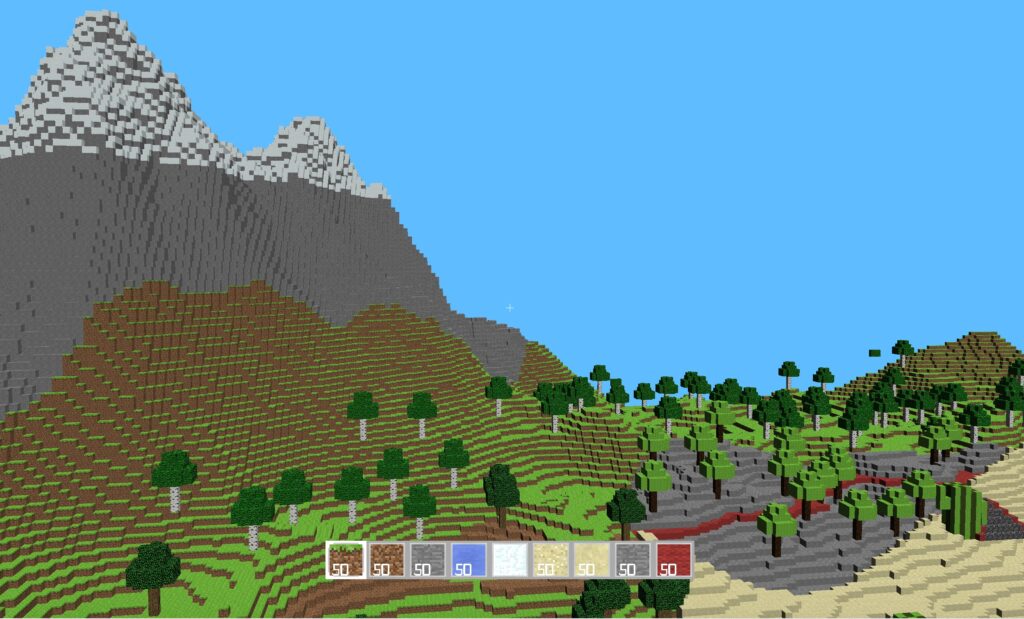
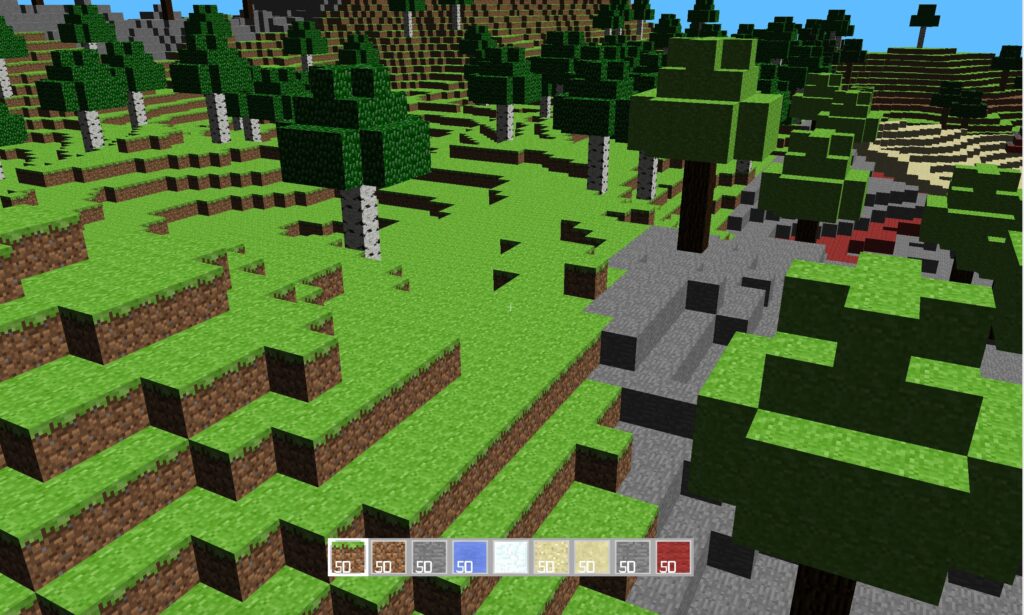
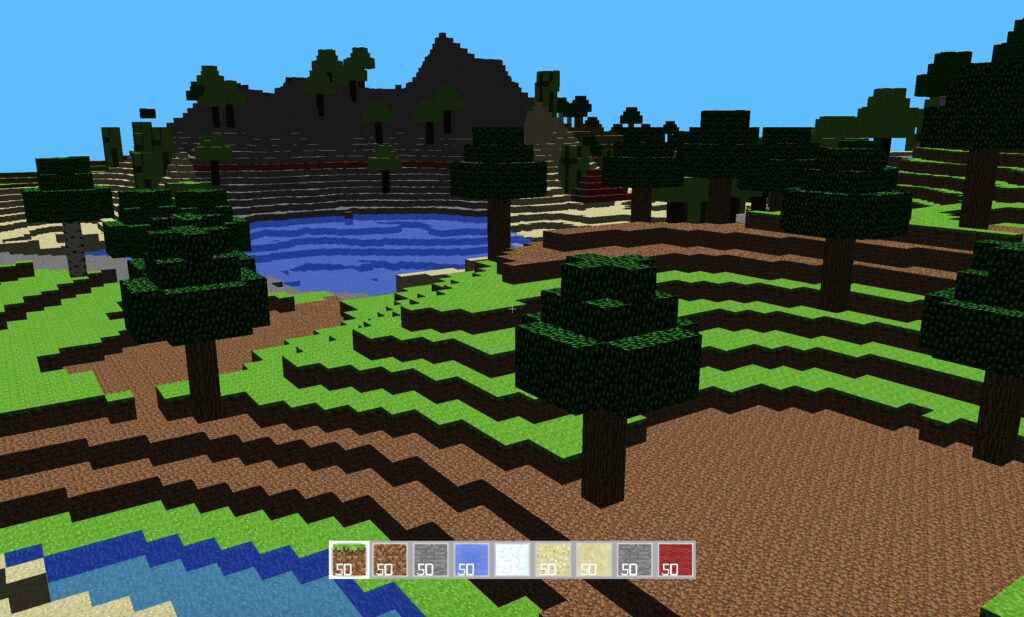
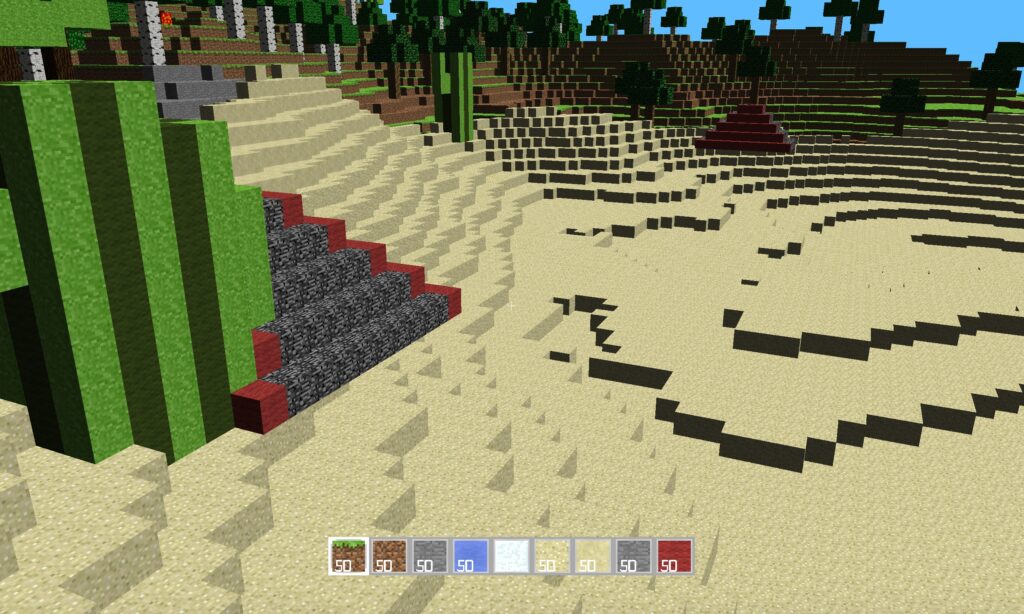
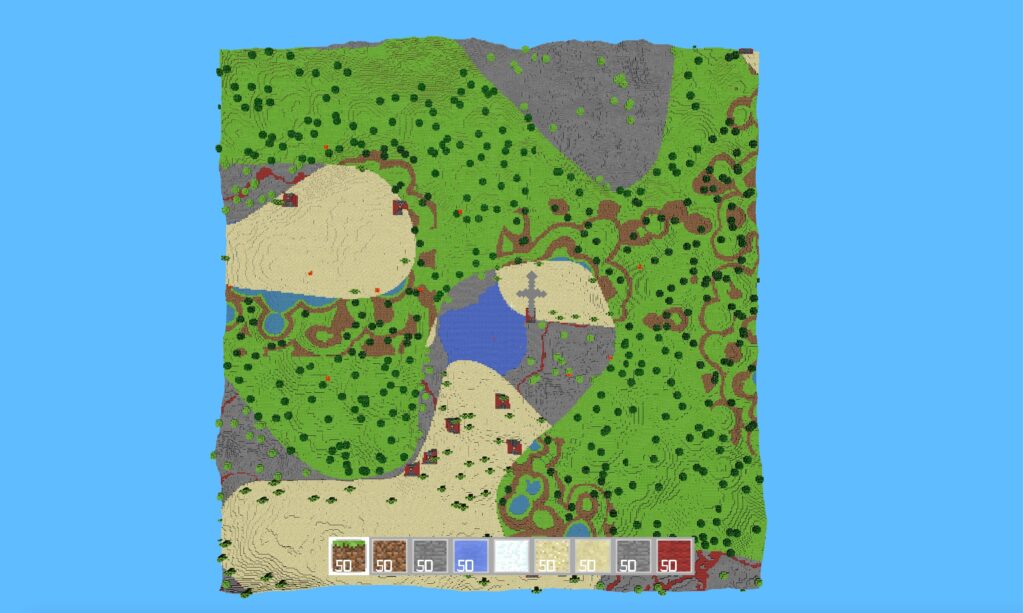
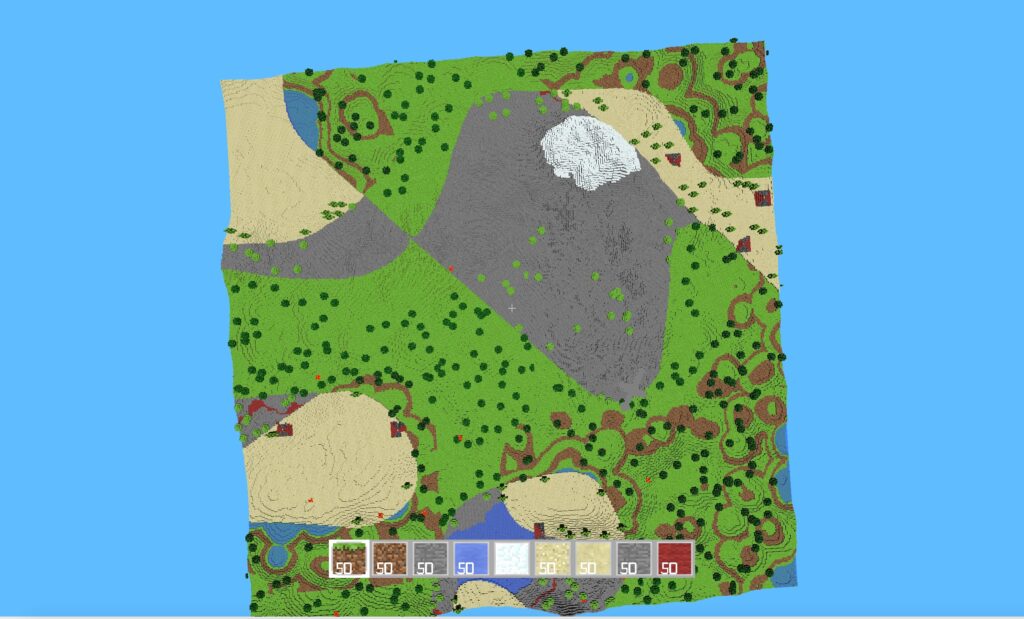
I created a total of four biomes using different procedural and semi-random mathematical functions in order to capture the key characteristics of each given landscape. These four biomes themselves are chosen by the intersection of two semi-random and distinct functions that represent ‘moisture’ and ‘temperature’ where for example the Desert Biome corresponds to a Low-Moisture and High-Temperature environment. These biomes are then blended for fluidity using a linear interpolation function so that the cliffs of a mountain gradually cascade into a desert and the hills of the grassland don’t suddenly flatten once a line is crossed. A given block that is considered can then for example have 60%-20%-5%-15% split for all of its traits/height among the four biomes. Once the height of a block is determined in this manner, certain logical conditions can determine certain attributes including the water levels, snow levels, frequency of trees/objects, dirt, etc. Note that the specifics of the randomness functions are rather complicated but in summary most randomness is built up using Perlin and Worley noise.
In addition to the four biomes that were created there is a system of caves that exist beneath the surface of the walkable world. These can be entered in specific points of the terrain and walked all the way down to the rivers of lava that exist on top of the bedrock that serve as a border for the game (refer to the above video for a walkthrough of this). The key difference in creating this “5th biome” is that instead of having a random function used for determining height, I had to take into account a 3-Dimensional space that could have value of EMPTY/FILLED independent of the blocks above and below it. There were several challenges with this task including the creation of steps down to this space as a natural way into these caves was not as aesthetic.
A.I. Non-Playable Character
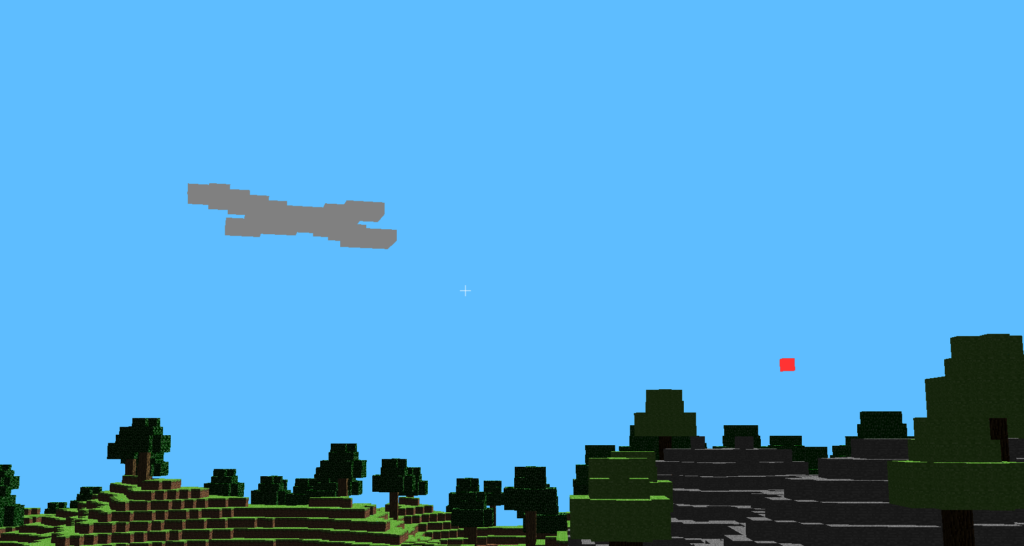
Hovering above the player in a randomized clover pattern is a ship that periodically drops bombs. This A.I. is loaded in as an obj file that is translated into the global world coordinates after being voxelized so that it can be represented as a grouping of cubes. This entity checks the world space for collisions 100 times every second and if it is about to intersect with a mountain it utilizes a modification of the A* pathfinding algorithm to avoid the obstacle. The A.I. maintains a physical shape so a player within walking mode is able to jump onto the ship if in range and move with it due to friction. In regards to the dropping of the bombs, the terrain will explode as the red block touches the ground with an explosion sound. Note that if the bomb directly hits the player then then entire screen will turn red until the player moves out of the way.
Multithreaded Terrain Generation
Multi-threading within this project is used so that the main thread that is viewed by the user is not slowed down by terrain generation that is constantly being updated on child threads. Each child thread is responsible for a specific terrain generation zone that is a grouping of chunks together within a certain radius of the player. In order to load these new zones in there is shared memory through an unordered set in the Terrain class. Furthermore, Mutex’s in the code are used so that certain operations do not occur simultaneously and crash the program.
Efficient Terrain Rendering and Chunking
Having an efficient way of rendering the terrain is an important optimization that allows for quicker gameplay and a larger radius of cubes around the player that can be generated. The image to the right displays this as instead of always rendering the six faces of a cube, connected sides are removed as they represent the inside of a larger shape.
The chunking refers to a 16x16x256 grouping of BlockTypes that allows for efficient generation of new spaces. Each terrain zone contains a set of chunks that are indexed by their location in the global map and are loaded into memory or forgotten based off of the players position. Chunking requires creating objects that inherit from the Drawable class and can be loaded from a given VBO format that contains the specification for a block size.
Game Engine Tick Function and Player Physics
A tick function within a gaming paradigm is a call to actions on a given time interval with the alternative approach being a purely event-based scheme. I use a tick function for many aspects of the world including the npc character, the player’s collisions, and terrain generation. In tandem with this I implement the typical KeyPressEvents that control the movement of the player and certain actions such as using the inventory and crafting table. The tick function itself is in the abstract Entity class so that ‘Player’ and ‘npc’ can override it as well as in the overarching mygl class as to be used in general gameplay
Player physics is predominantly comprised of collisions and movement when running/jumping in the world. Collisions work through the use of ray tracing in a multitude of directions and lengths every tick so that regardless of the way in which a player approaches an object there will be a detection of it and a change in gameplay. Movement is based off of the classical physics model with a constant downward acceleration that includes a terminal velocity when falling due to air resistance. Further, all typical forces including friction are taken into account in the player’s acceleration as happens when running around the world. Note that none of these are applicable when the player is in flight mode and can move around freely.
Post-Processing Effects
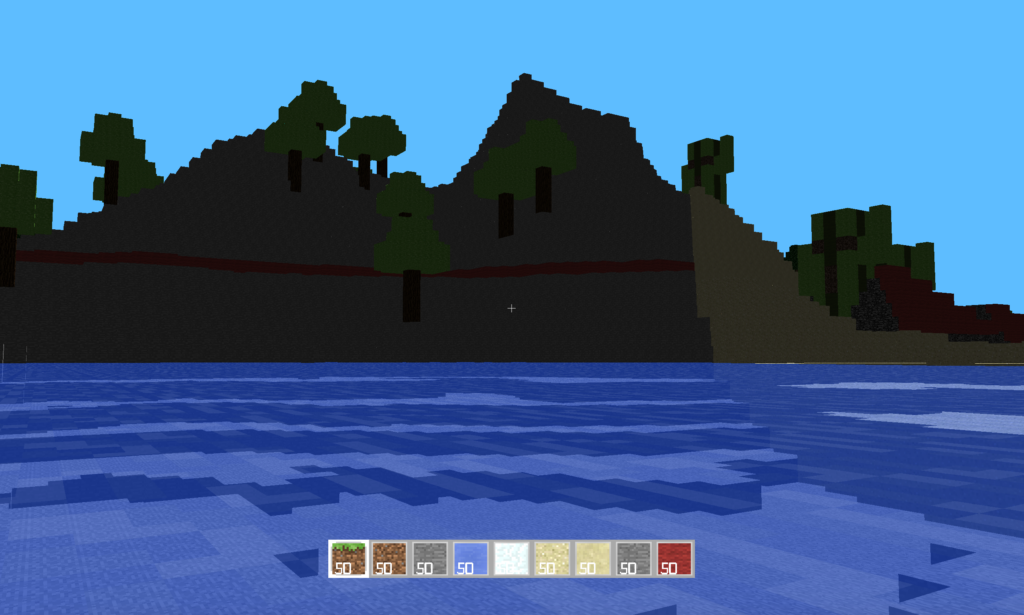
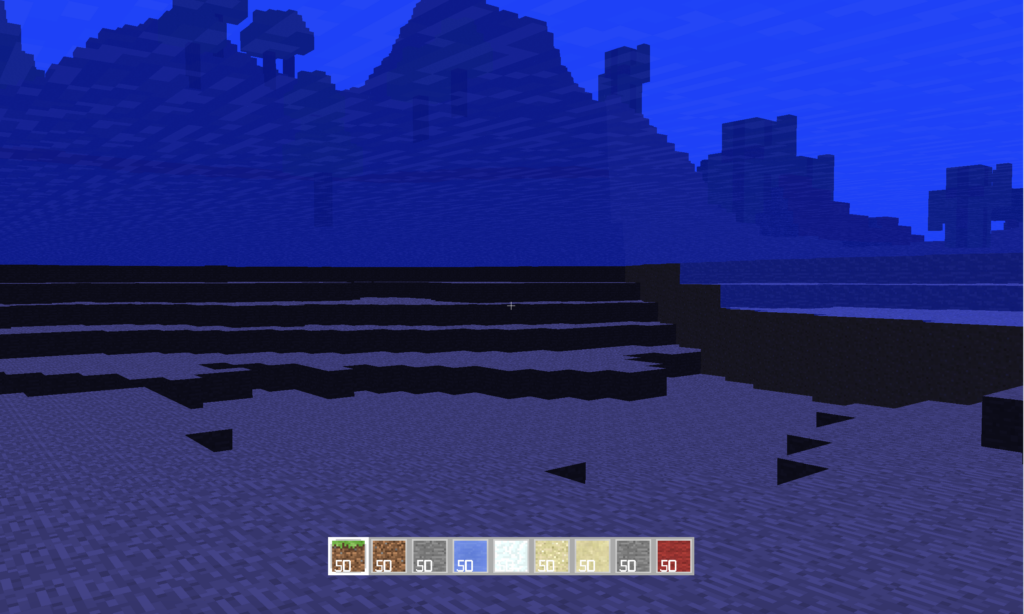
Post-Processing Effects are used in the world in order to tint the screen blue in water and red in lava. Consider the simplified OpenGL pipeline to be as follows:
Vertex Data > Vertex Shader > Primitive Assembly > Rasterization > Fragment Shader > Frame Buffer
The default FrameBuffer is the screen, so in order to include the desired effect I created a new Buffer object that takes in a quadrangle to fit over the entire game and call new Vertex/Fragment Shaders with it that can then output to what the user sees.
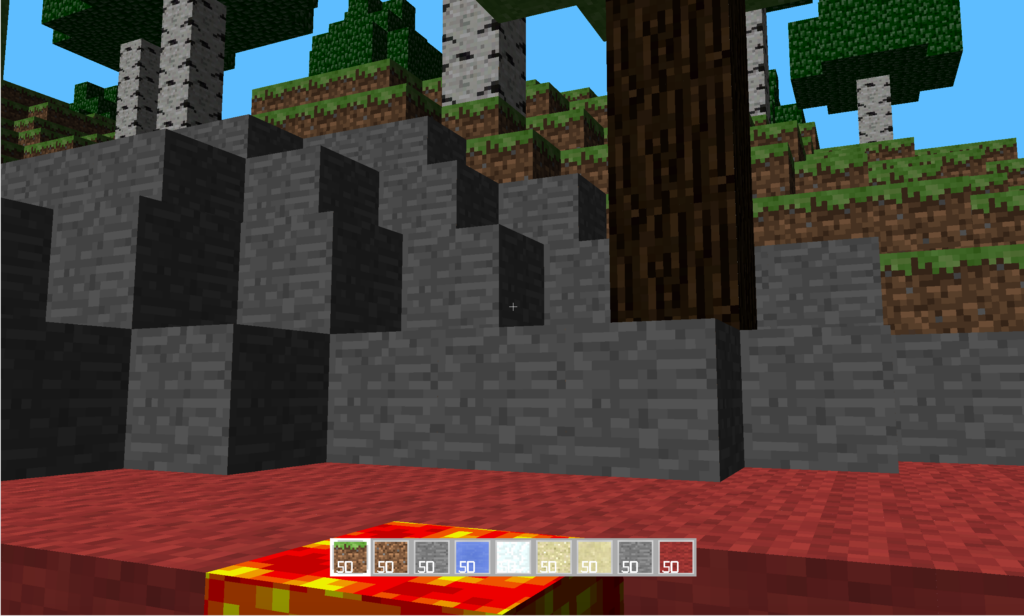
Texturing and Texture Animation
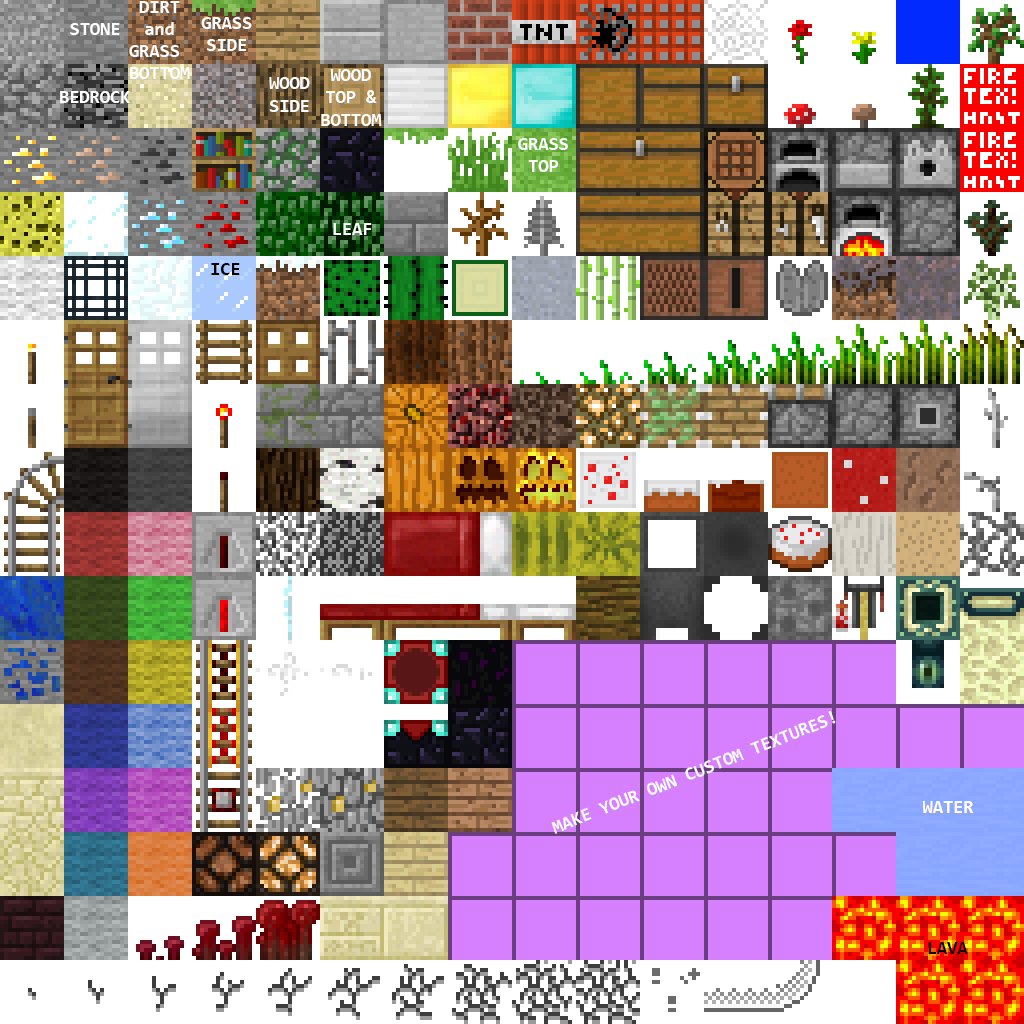
I used a texture map to link the different images to the faces of each of the cubes used within the terrain. An enumerated BlockType decided how that specific face was to be chosen from the texture map seen to the right. In addition to this, I used a normal map to add depth to the cubes based off of the normal vector from the camera to each pixel within the image.
Further, the alpha coordinate of each pixels color is used as an indicator on the transparency-opaqueness spectrum so that blocks such as water could be seen through while wood does not show anything behind it. In the same vein, all opaque blocks have their color information rendered first as it is not possible to retroactively alter the coloring of a transparent block.
Inventory / Crafting
Similar to the game of Minecraft, a dynamic inventory is shown at the bottom of the screen with the quantities of a chosen eight elements. When the user presses ‘i’ there is a deeper inventory and crafting toolkit that appears with a Drag-And-Drop capability that contains hardcoded recipes for constructing new blocks. Right clicking allows for specific quantities of a uniform block to be distributed to either craft or store differently.

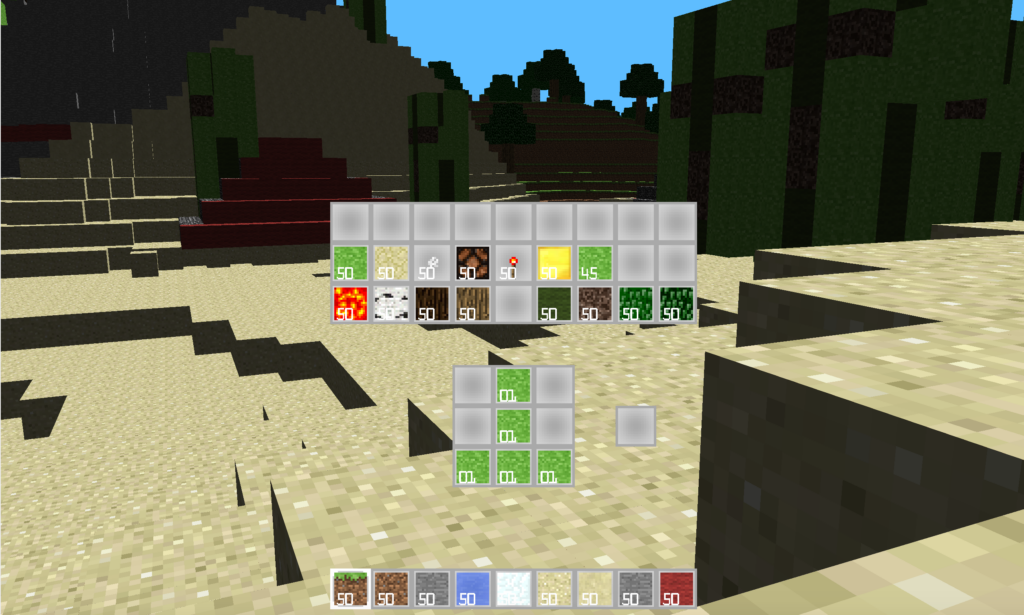
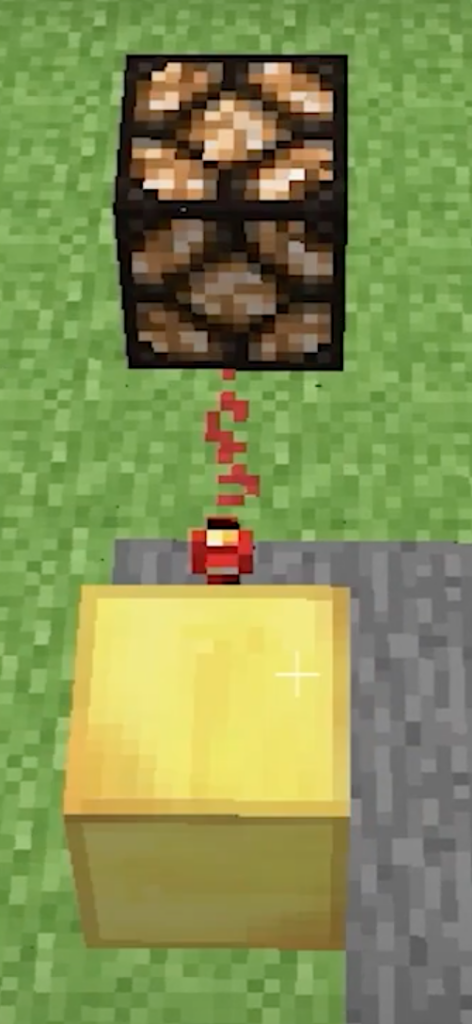
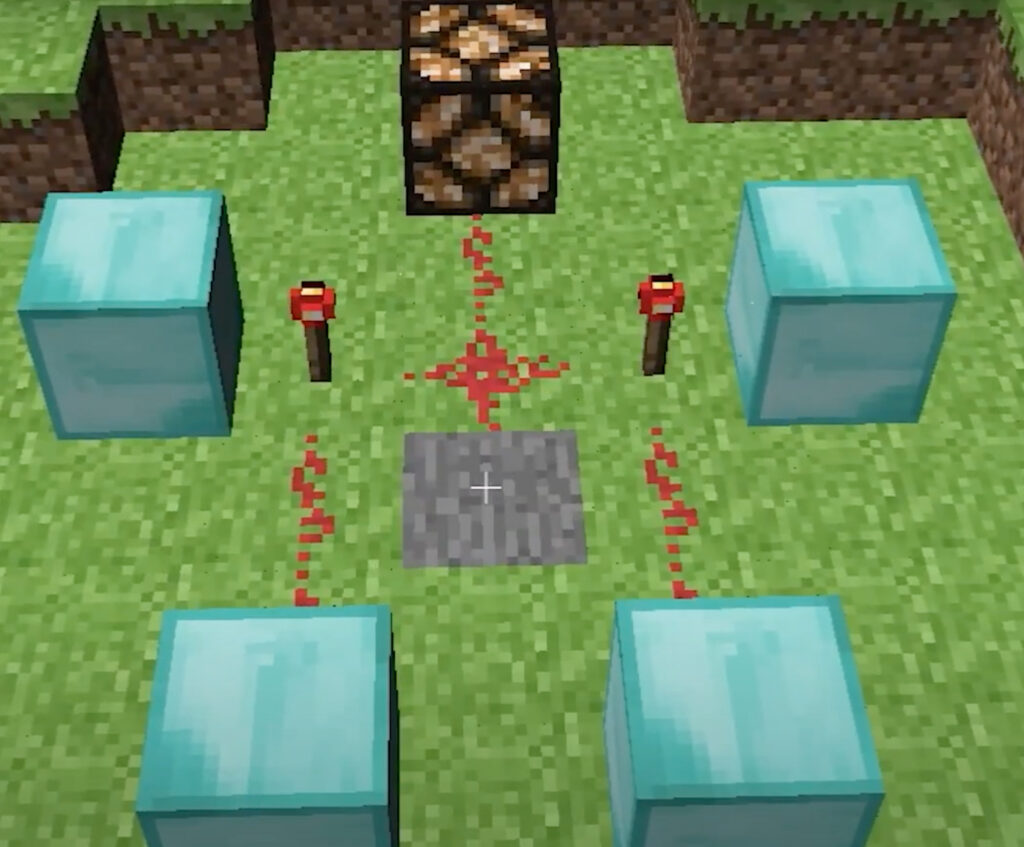
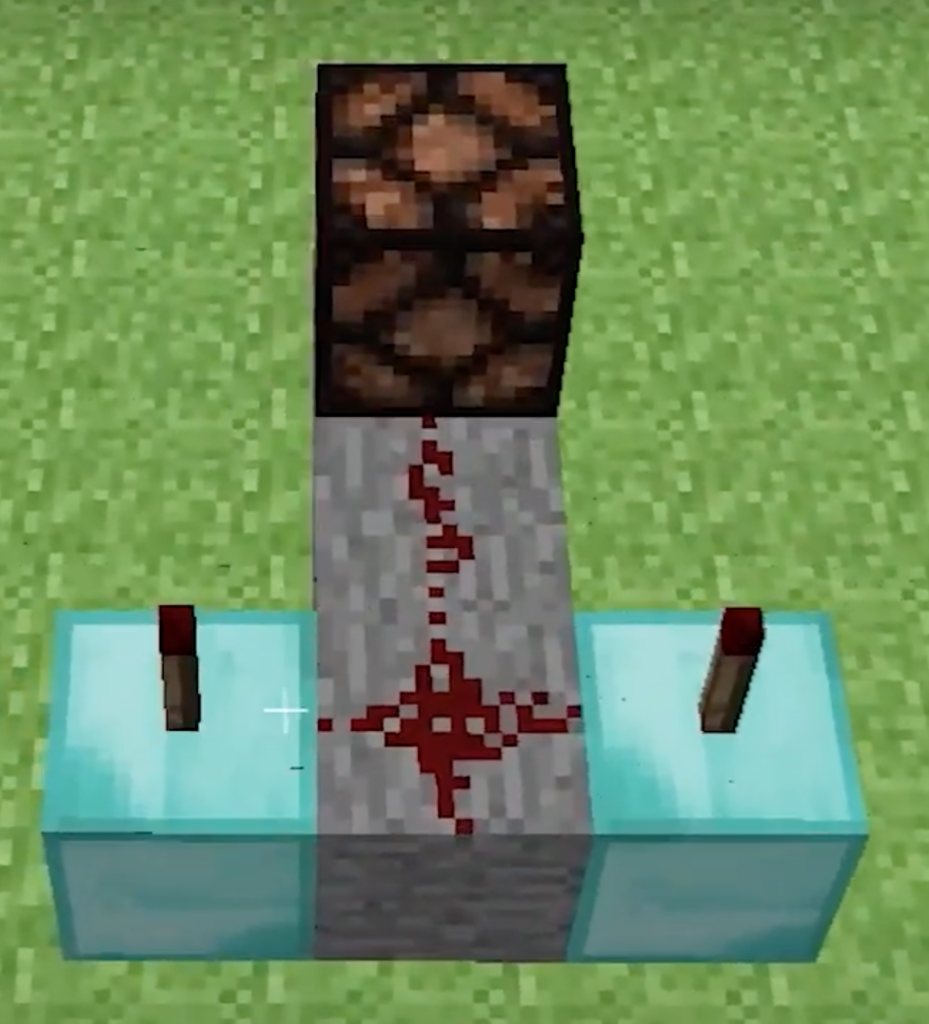
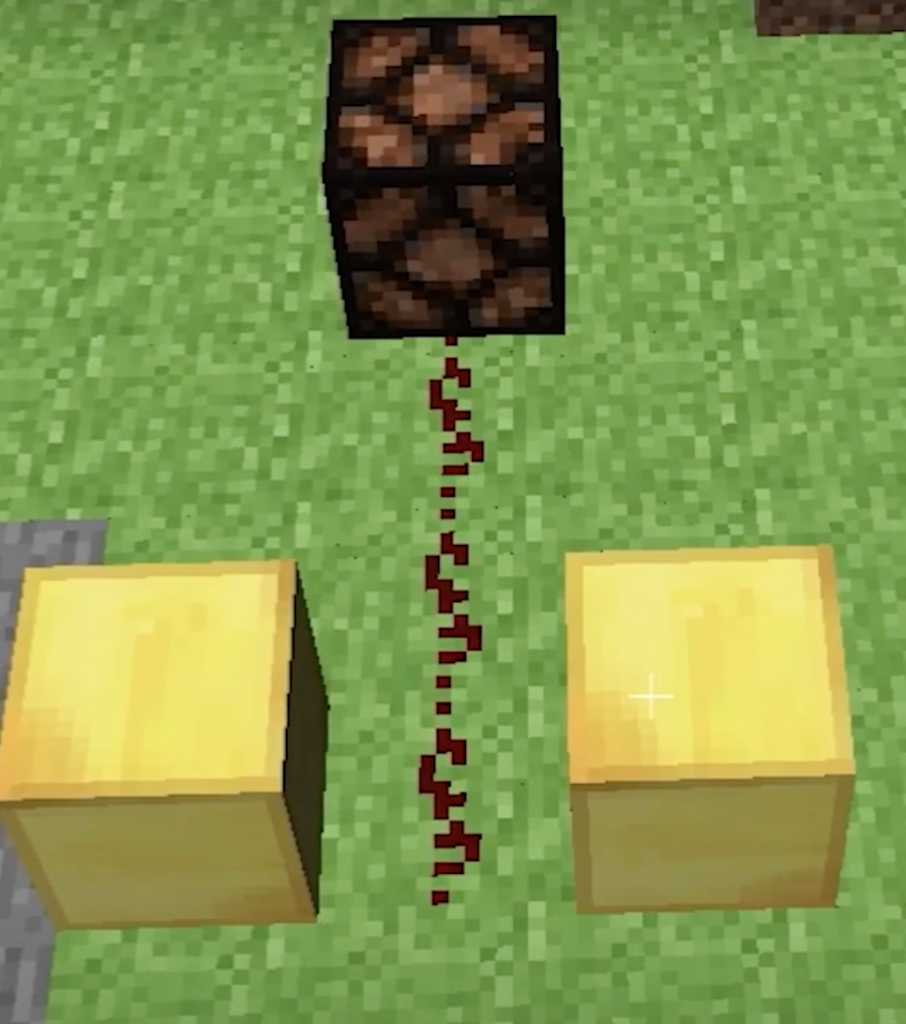
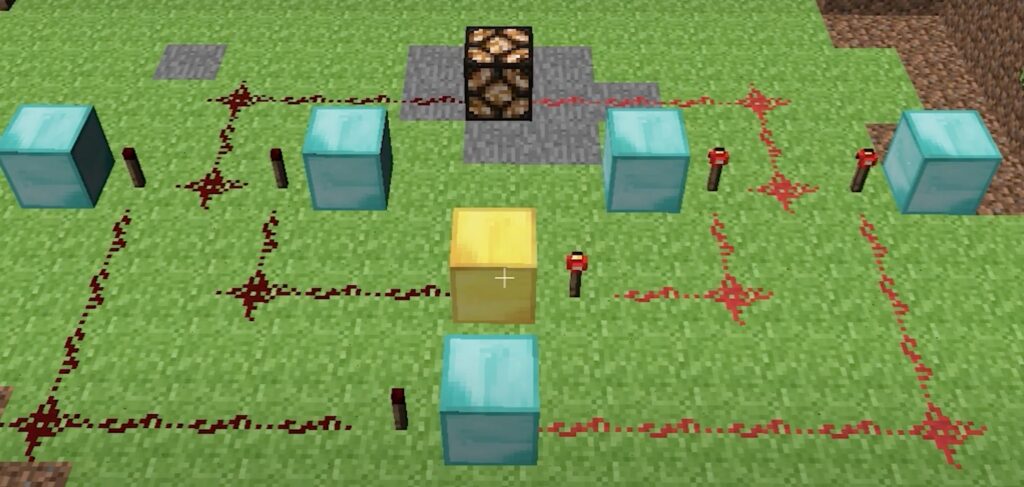
Redstone
The Redstone capability within Minecraft (and in my miniature version) is a way to create logic and currents that can be used to light up lamps as shown below or perform specific tasks. Using the five gates below we could theoretically build up an entire computer at a large scale that is Turing-Complete. Due to spacial confines this is not truly realistic, but a functionality such as a calculator could certainly be built up within my version of Minecraft. Note that building up this capability included the challenge of having partially transparent blocks as is demonstrated by the lamps. For demonstrations on how each of the gates below work please refer to the last 30 seconds of the video linked above.
Mini-Facebook
This project is a miniature version of a social media platform that includes all of the standard features including chats, friends, postings, news, visualizations, and more. It was completed in December 2021 with two peers as a final project for a ‘Scalable and Cloud Computing’ course. The technologies used include Bootstrap on the front end, DynamoDB and Amazon S3 for storage, Apache Spark for friend/news/post computations, socket.io for web socket needs regarding chats, and AJAX with jQuery for page integration.
Chat
For the chat, a standalone page was implemented using the socket.io library along with three tables in DynamoDB (Users, Friends, and Chat). In order to have both readability as well as uniqueness for each of the chats, there is both a name (sort key) and a uniqueID (partition key). The name is set by the user at creation time through a popup and the id is automatically generated in the format of: ‘username’ + ‘unix epoch time’. Moving on to the specific tables that were used, the User Tab maintained two lists that were changed with UpdateItem’s ‘list_append’ method as a user either join a chat or is invited to a chat: ChatInvitations and Chats (both of which stored the chatID). The Friends chat is used when inviting others (in conjunction with the User tab to see who is online), as a way to quickly query the friends of any given user. The Chat table maintained the id, name, and a list of JSON stringified messages, each of which held the sender, timestamp, and actual message. The Chat table is sent a message each time the ‘send button’ is clicked, but is only queried when a given user enters the chat because all other messages between users while online are done through socket.io. Creating a chat is done through buttons on either the toolbar or side page of home.ejs. The side page also maintains all current chats and invitations that a user has available to them.

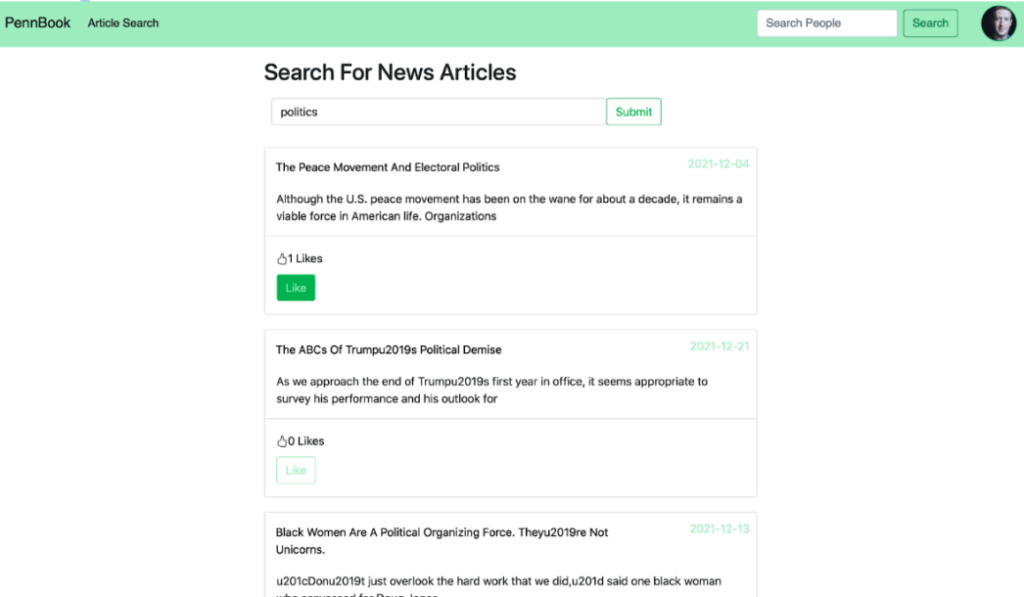
News Search
For the search functionality pertaining to news, an Article Index table is used in order to query for articles based on a particular key word. The results from those would then get sorted based on the number of keywords they matched by storing the articles in a map with the article item as the key and the number of matched terms as the value. The map was built into a sorted array. Then, there is a lookup for all the recs for a given user and there is storage for all of the article recs that have a weight. These weights are then scaled and the list of articles is sent back to the front end for display. An AJAX call is used to give a user’s article recommendations daily. This is done by first obtaining the user’s recommendations, and then cross-referencing these with articles that the user has already been recommended. This involves an Article Recommendations Table and a Given Recommendations table that both have username as a partition key and a list of article IDs as a sort key. Once the most recommended article that is not in a user’s given recommendations is retrieved, then the site will update the current user’s list in the Given Recommendations table or make a new item for them if nonexistent. This recommendation then is sent back to the page and displayed on the front end. Additionally, inside the function call there is a check at the beginning that determines whether an hour has elapsed before making a command line call to run the adsorption algorithm.
Login/User Registration
When a user creates an account, they must fill out all of the provided fields (and they get an alert if they try to submit without doing so). This includes selecting at least two topics they are interested in. A hashed version of the user’s password gets stored in the “users” table; when the user logs in, the hashed version of the input is compared to the version in the table associated with that username. Once logging in, the user’s username is stored as a session variable. If the user attempts to visit a different page without being logged in, they will be redirected to the login page.


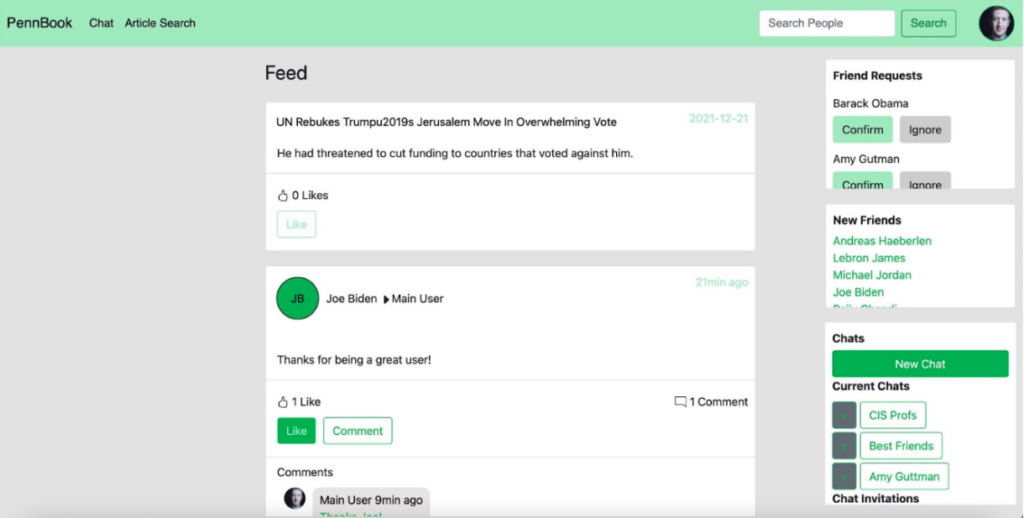
Home Page
On the home page, the logged-in user can see their incoming friend requests, new friends, current chats and chat invitations, and a feed of articles and user-created posts sorted by time. Posts, likes, and comments are all dynamically updated every thirty seconds; if another user were to create a post, comment on a post, or like a post, then the feed would update accordingly. Comments that are displayed also feature the commenter’s profile picture. Retrieving the posts requires calls to multiple DynamoDB tables, including a Posts table, Comments table, Likes table, Article Likes, and Users table. Posts are kept track of with a unique post ID, users are kept track of with a unique username, and comments are kept track of with their timestamp. The home page (as well as all the other pages) is rendered with Bootstrap 5 and uses AJAX calls with JQuery to dynamically update the content. Friend requests immediately disappear once they are responded to, and if a request is accepted the new friend will show up under the New Friends section. The home page also allows the user to enter existing chats, respond to chat invitations, and create new chats.
Wall
The wall mainly relies on the “Users” and “Posts” tables in DynamoDB, as well as an S3 bucket titled “g02.posts” to store profile pictures. When rendering the “About Me” section, a call was made to the “users” table that queried based on the current session username, retrieving information like name, affiliation, email, and a list of interested topics. During this call, the user’s profile picture is also retrieved from the S3 bucket, and in the case that the user has not set one, an image of an anonymous user will be displayed in its place. If the user clicks the “Add Profile Picture” button, they can navigate their files and choose a file of size less than 70kb. If the user clicks the “Update Account Info” button, they can change their email, password, affiliation, and interested topics, where their current information (besides password) is already filled in. Changing affiliation or interests will automatically create a status update for the change. Saving changes will use an AJAX call to update that user’s information in the “users” table.
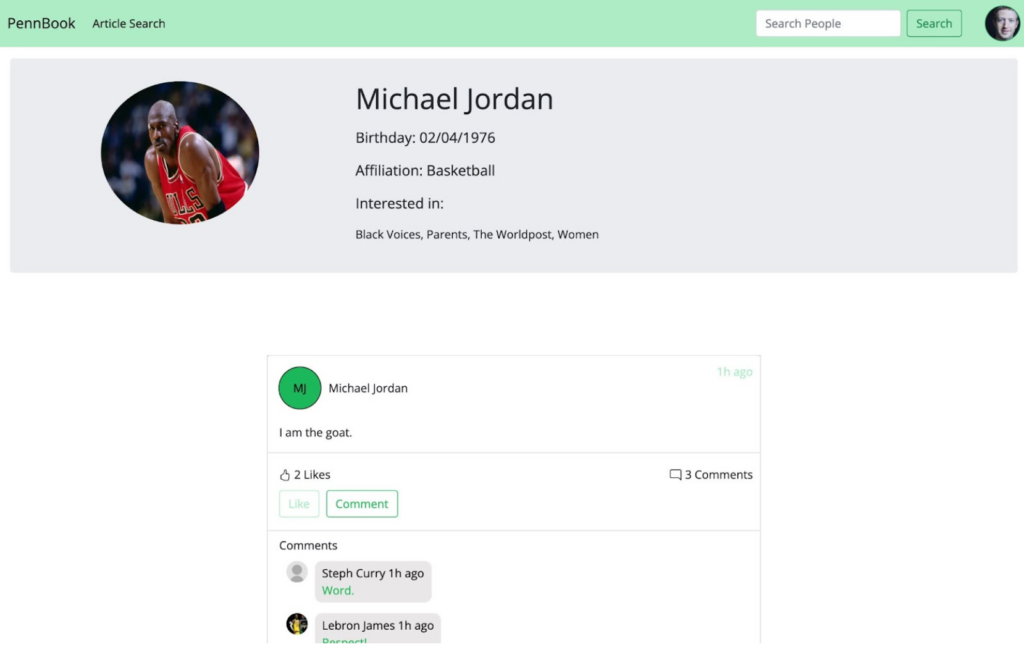
Once on their wall, the user has the option of creating a new post with/without media and to their wall or a friend’s wall. If the user chooses to post on their friend’s wall, a modal will appear with a list of their current friends, allowing them to choose one. The wall will dynamically update once a post has been added, and a call will be made that adds the post to our “posts” table.

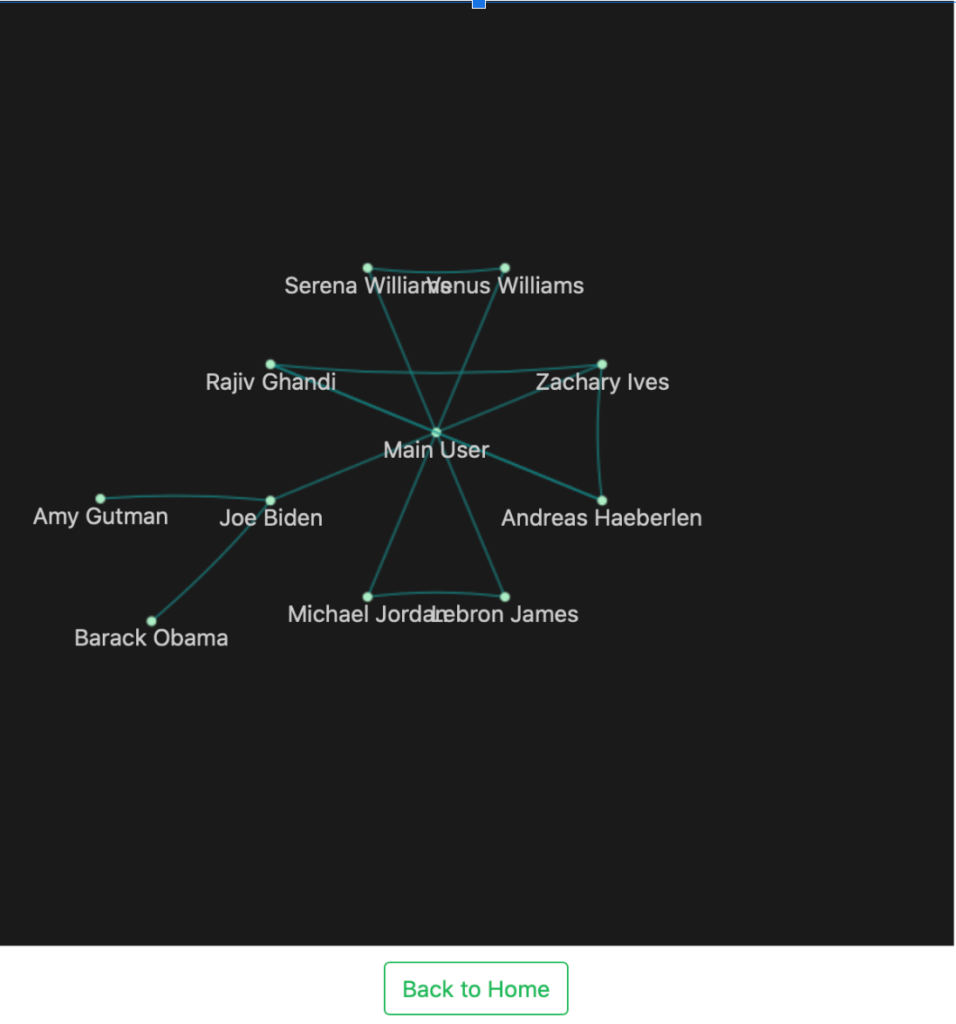
Visualizer
The visualizer tool in this project is a way to see the connections of an individual beyond the strict follower/follow relationship. As seen to the right (demonstrating the connections of Main User), we are able to see a certain number of our friends friends and can visually see which of these are connected. This tool serves to show a demonstration of how I create friend recommendations (those who are more intertwined with an individuals network are more likely to be presented as a potential friend).
M.L. Notebooks
Cryptocurrency Wealth Inequality
I set out on this project to find the differences in the wealth gaps within notable cryptocurrencies including Bitcoin, Ethereum, and Tether as compared to fiat currencies. I was able to come to several conclusions including the relationships between a Proof-of-Work v.s. Proof-of-Stake protocol in relation to wealth inequalities and environmental factors such as the pandemic leading to a larger disparity.
Global Temperature Predictions
I chose a project relating to environmental analysis as it is one of societies most pressing issues and inherently predictable with policy, pollution, etc. all serving as ‘features’ for the temperature to be fit to. The conclusion of my project matches that of the Global Health Report on Climate Change that was published within the past year: that policy change is needed to lessen climate changes effects.
Convolutional Neural Nets
This project is an extension from the RoboCup competition as is described in a later project. Essentially, my aim was to have a robot feed an image into my classifier and have it identify which type of sign it is being shown. By the end of the training I was able to create a neural network that predicted the sign with as good accuracy as my previous neural network which was a simply detection binary.
Cryptocurrency Wealth Inequality
We create a few linear regression graphs to demonstrate the strong (positive or negative) correlations between Time vs Number of Ethereum Transactions, Number of people who own $10 million to $100 million USD worth of Etherium, and Average Fees. Note the Dates are one-hot encoded into integers, with the integer corresponding the the number day since the first date entry in our dataset (August 2016). For example, Date of 200 stands for 200 days since August 2016. The resulting graphs show that each of the graphed features are positively correlated with time elased, validating our claim about how time has a direct correlation to wealth inequality and popularity of a given cryptocurrency.
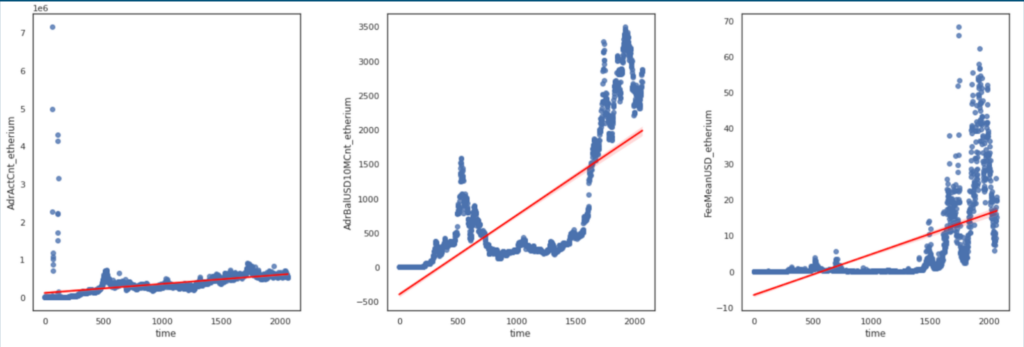
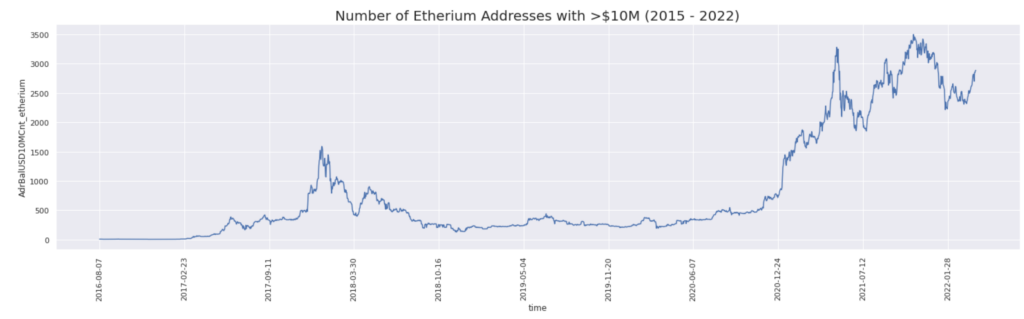
Interestingly, while the amount of weath that Bitcoin addresses with over 1M USD and over 10MUSD went up at the same rate, Ethereum accounts with over 10M USD gained got significantly more wealth than accounts with 1M USD. As a result, we can conclude that while ~1% of Bitcoin and Ethereum addresses own the majority of the wealth, there is an even smaller percentage of Ethereum accounts, those that have over 10M USD, that are significantly wealthier than everyone else.
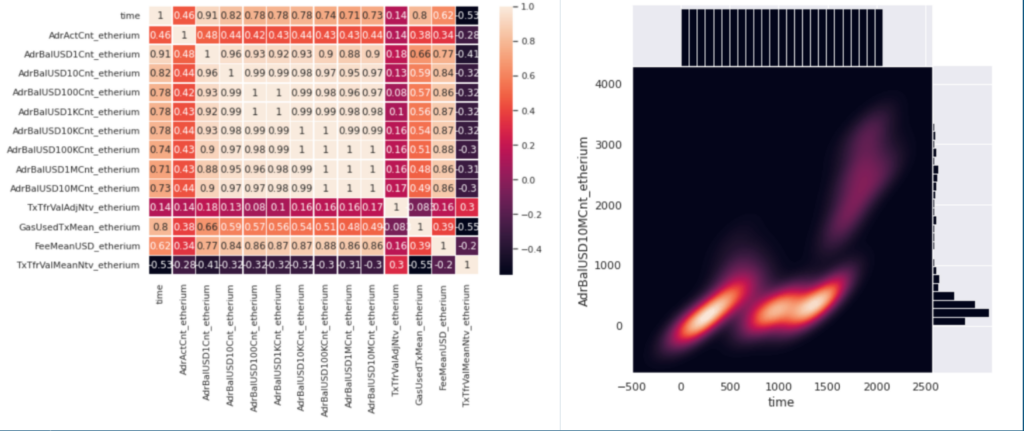
For data modeling, we will hone in on one popular cryptocurrency among our datasets: Ethereum. This cryptocurreny has served as a well-known name for the blockchain world, so our team in this section trains a model that is able to predict the (ranged) amount of individuals with $1 million to $10 million dollars USD given feature parameters such as fees, number of daily transactions, and mean sum of USD transfered each day. By modeling the amount of individuals who have $1 million to $10 million USD of Etherium currency, we aim to represent the individuals who simulate the top 5% (in terms of wealth) in the Etherium blockchain. In this manner, when given specific parameters, our model can predict how much wealth inequity will result from those parameters. An increased amount of individuals who have $1 million to $10 million USD of Etherium currency correlates to increased wealth inequality (as currency on Etherium is being concentrated among the rich). Contrarily, a decreased amount of individuals who have $1 million to $10 million USD of Etherium currency correlates to increased wealth equality.
Environmental Analysis
Let us summarize some of the most important results:
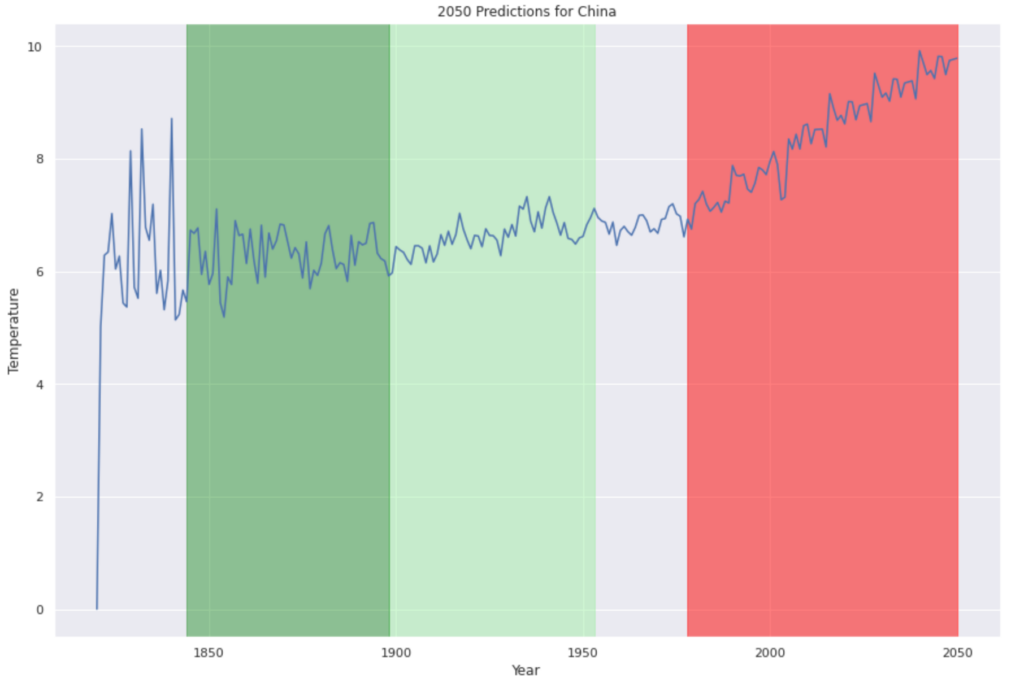
- Our predictions indicate that without changes to the current trends we will reach the levels of risen temperature that the UN Climate Report deemed ‘too far to come back from’ within the next two decades.
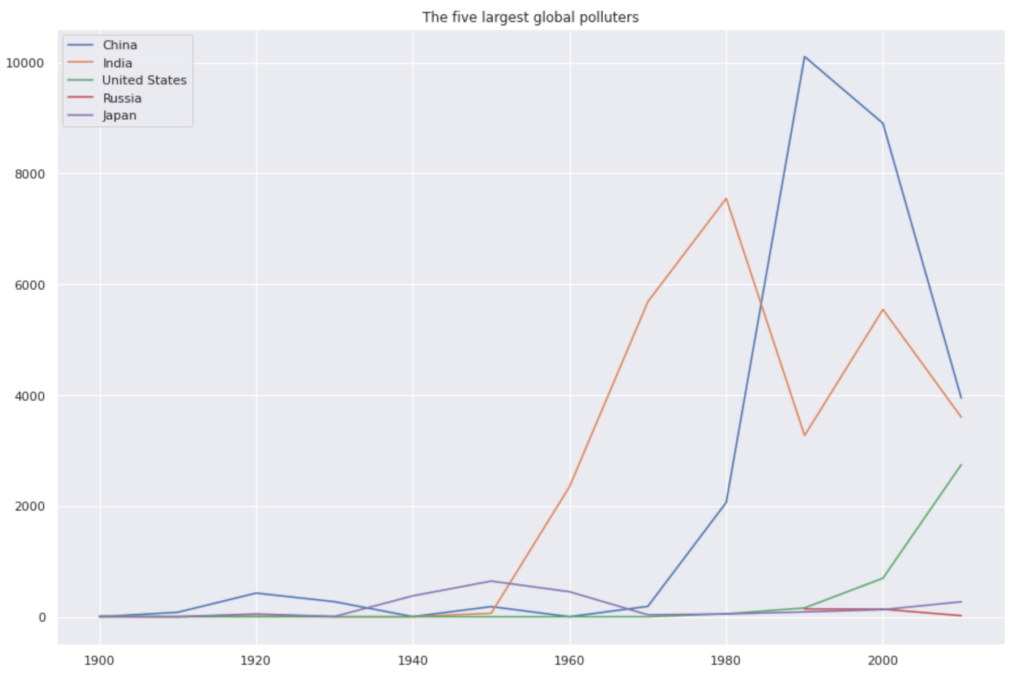
- Over time, there is generally a correlation that includes an increase in pollution in the ability to predict a Country (and world’s) rise in Global Temperature. We originally attemped to split this up country by country in terms of pollution, but were not able to create a strong correlation because countries that border each other and have very different policies would still see similar trends purely due to regional proximity.
- There is a strong correlation among countries that are experiencing a rise of natural disasters and countries that are the top pollutants.
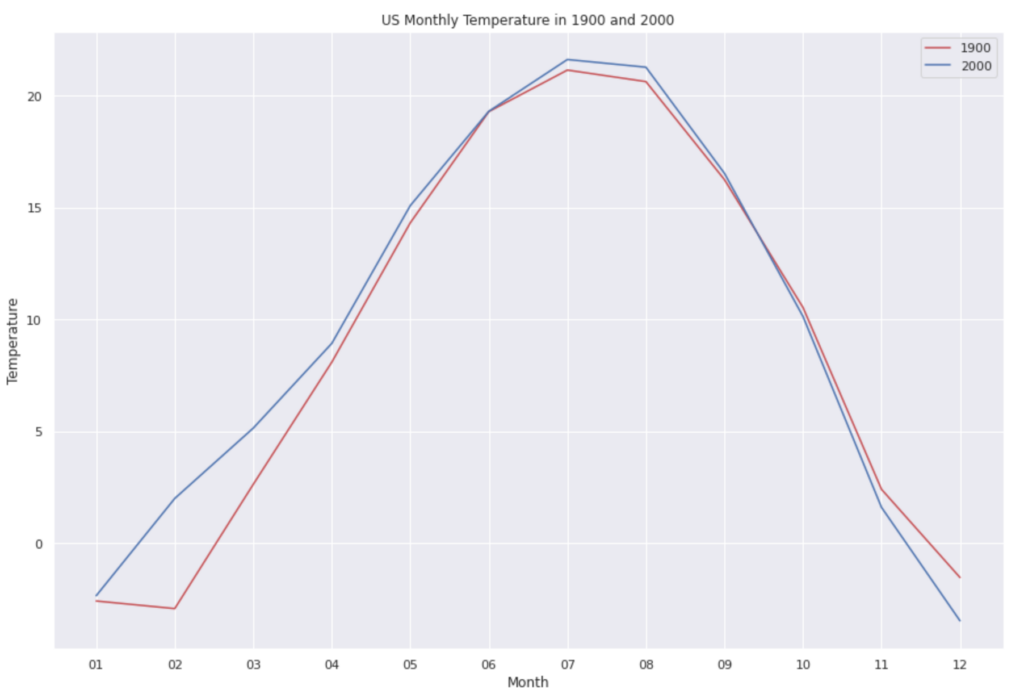
- Last, but definitely not least, we can see that the vast majority of countries, states, and cities all have increasing temperatures and have an average temperature that has only increased thus far. The lowest rate of increase this far has been the states at an 84% rate for increasing temperatures overall from 1900 to 2000. This is not a low percentage and was only over a century.
In conclusion, we have confirmed with data many of the fears behind climate change at its current rate. What this data, and no data from the past, can tell you is exactly what will happen in the distant future where technological innovation and international efforts may be able to hinder the rates that we have predicted.
Convolutional Neural Networks
This project involved using convolutional neural networks in order to learn which one of the near 50 recognized street signs is mapped to a given image. Note that a typical neural network without the pooling and convoluting layers is typically reserved for non-image data and is not as helpful for unscaled data.
In order to appropriately train and test the accuracy, precision, recall, and mean squared error of the network, I split the data into 80% training and 20% testing. Furthermore, all of the provided images has a corresponding label that is given. For example, this could be titled “Stop Sign” or “Yield Sign” or “Pedestrian Crossing Sign”. The goal is to output one of these titles when we are fed any new image and I was ultimately able to get an accuracy in the mid 90%’s.
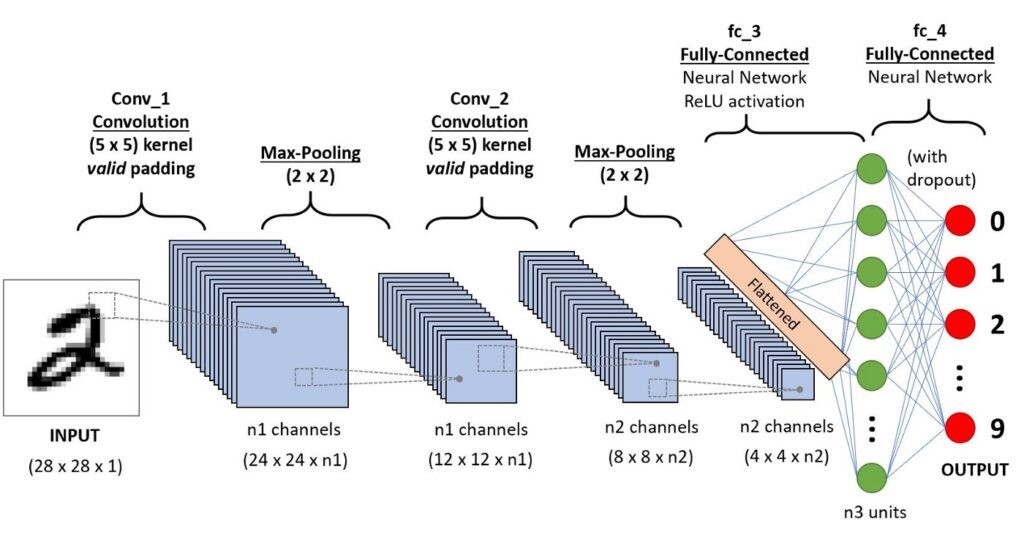
Here, I defined the creation of my convolutional neural network that contains a single sequence of Max-Pooling to Convolution operations on the data as to identify the maximum contrast between edges to recognize the shapes of Street Signs. This was ultimately able to predict (on 25 iterations) which street sign was read after seeing an image of it with an over 95% accuracy.
def construct_conv_net():
  net = gluon.nn.Sequential()
  with net.name_scope():
      net.add(gluon.nn.Conv2D(channels = 20, strides=2, activation='relu'),
              gluon.nn.MaxPool2D(pool_size=4, strides=4),
              gluon.nn.Flatten(),
              gluon.nn.Dense(len(train_dataset_dict)))
  return net
Training the convolutional neural network consisted a series of steps outlined as follows:
- Must define an accuracy metric of some sort (I used mxnet.metric for reference)
- Must train the data on the number of epochs so that the data can become more and more refined to targeting specific features, with my default number of epochs being ten
- Iterate through each of the mini batches within the training data set
- ‘Flatten’ the Channels which means feeding the red, green, and blue channels into a greyscale that can be read as a single number
- Send all information to the Graphics Processor (GPU) so that I can leverage parallel computing at a greater rate than on the CPU (note that this is a physical hardware boundary and that I use as_in_context in order to transfer the data in a single and readable format)
- Compute the models outputs and losses so that we can see the accuracy with with the model trains after each iteration of the training (needed to insure constant improvement)
- Back-propagate so that on the next iteration each of the weights on the features are better optimized
def train_cnn(net, train_loader, criterion, trainer, metric, epochs = 10):
loss_ave = 0
for iter in range(epochs):
loss_s = 0
sample_s = 0
metric.reset()
for mini_batch in train_loader:
dat = mini_batch[0].
lab = mini_batch[1]
dat_to_send = dat.as_in_context(ctx)
lab_to_send = lab.as_in_context(ctx)
with autograd.record():
model_output = net(dat_to_send)
model_loss = criterion(model_output, lab_to_send)
metric.update(labels = lab_to_send.as_nd_ndarray())
model_loss.backward()
trainer.step(dat_to_send.shape[0])
loss_s += sum(model_loss.as_np_ndarray())
sample_s += dat_to_send.shape[0]
loss_ave = loss_s / sample_s
final_training_accuracy = metric.get()[1]
final_training_loss = loss_ave.asnumpy().item()
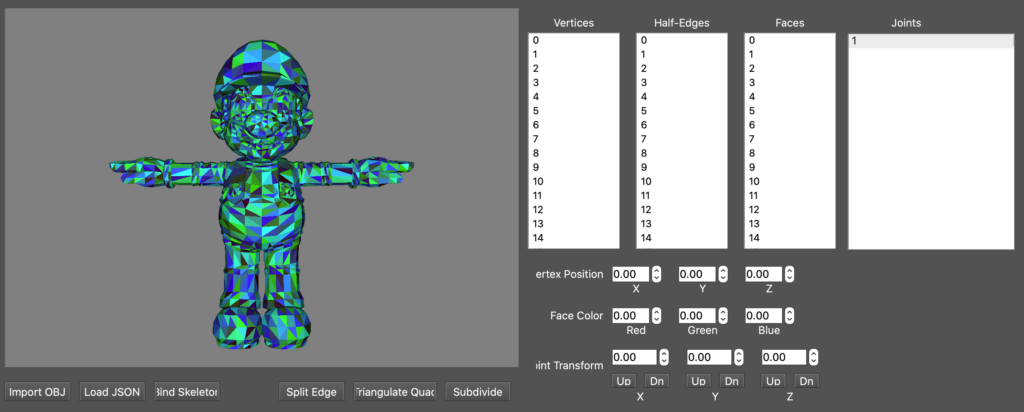
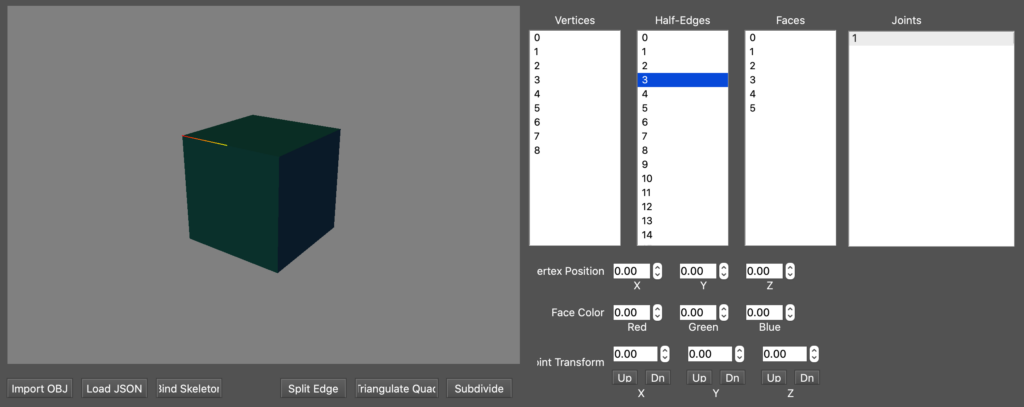
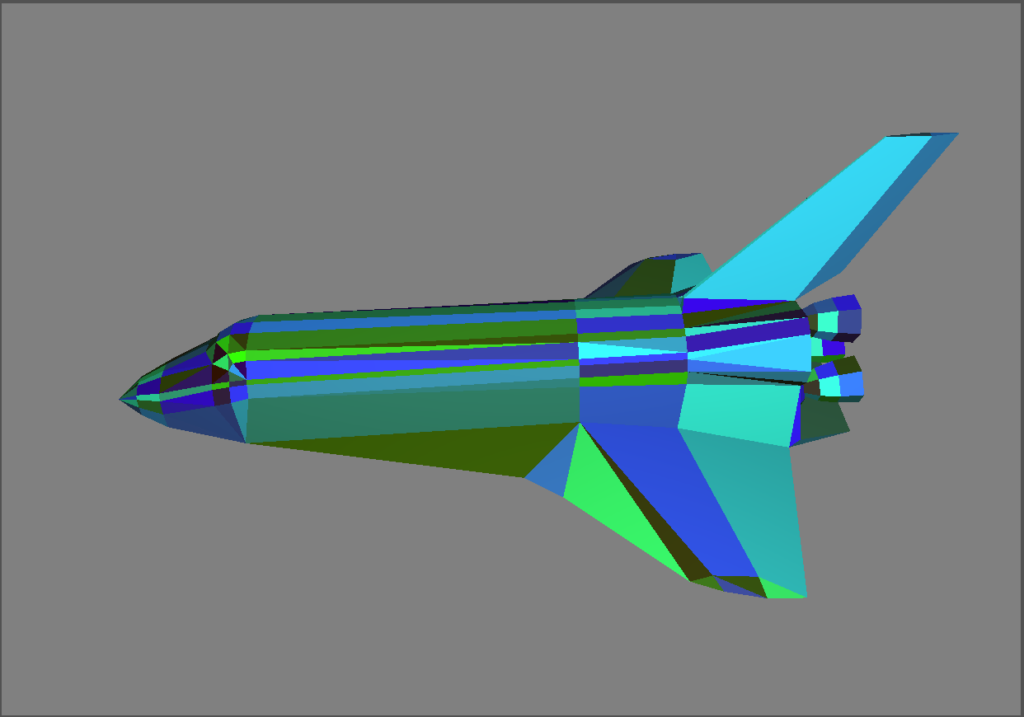
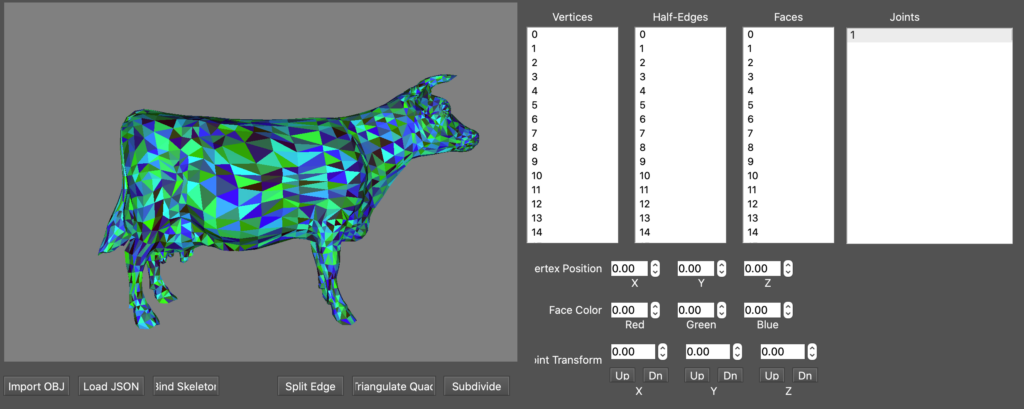
return final_training_loss, final_training_accuracyOBJ Subdivision/Skeleton
The essence of this project which was written from scratch can be broken down into three distinct components:
- The Creation of a Data Structure that can be used to load an obj file into my Programs GUI
- Various features that can be applied to the loaded obj including subdivision, splitting edges, and triangulating quadrangles
- Binding a json skeleton to the obj that moves the ‘joints’ loaded in to reshape the mesh accordingly
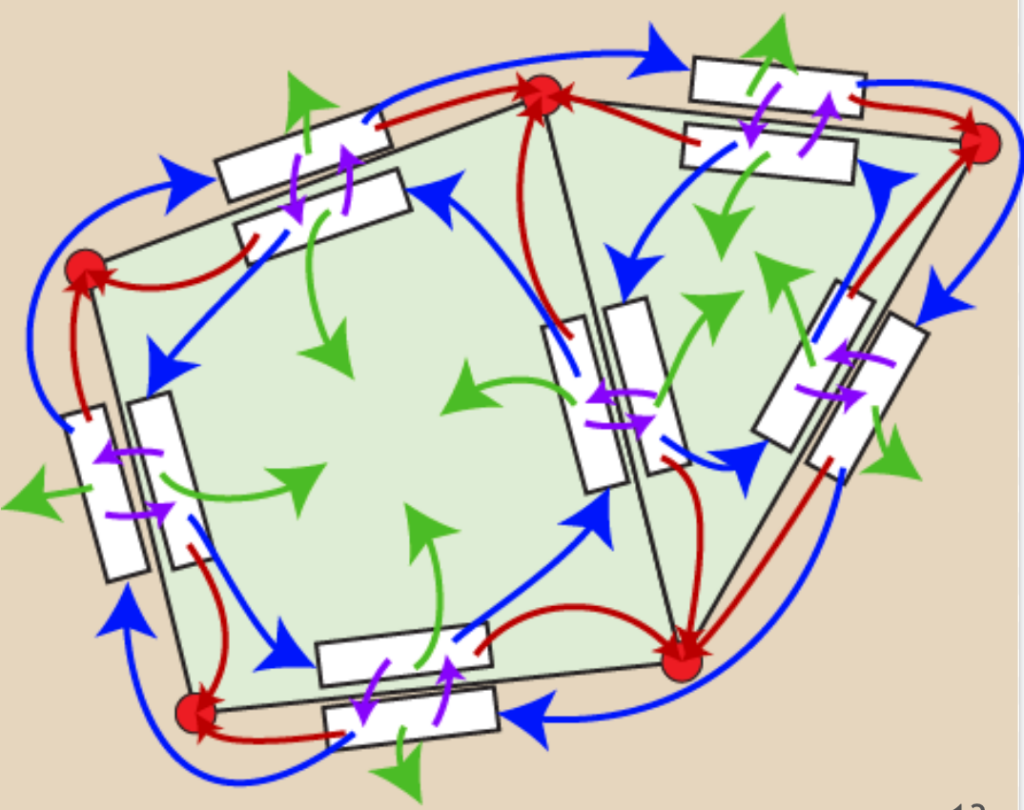
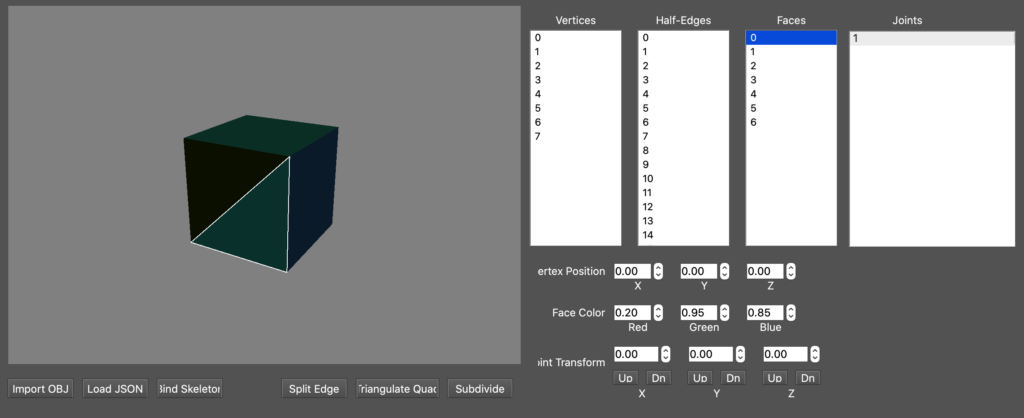
Half-Edge Mesh
In order to load in complex obj files I designed and implemented a Half-Edge Data Structure that contains a Face, Vertex and Edge class with the pointers shown in the image to the right.
The GUI contains the ability to select vertices/edges/faces, split the edges in half, triangulate faces, ‘smoothen’ the current mesh, and import a JSON skeleton that can move the mesh.
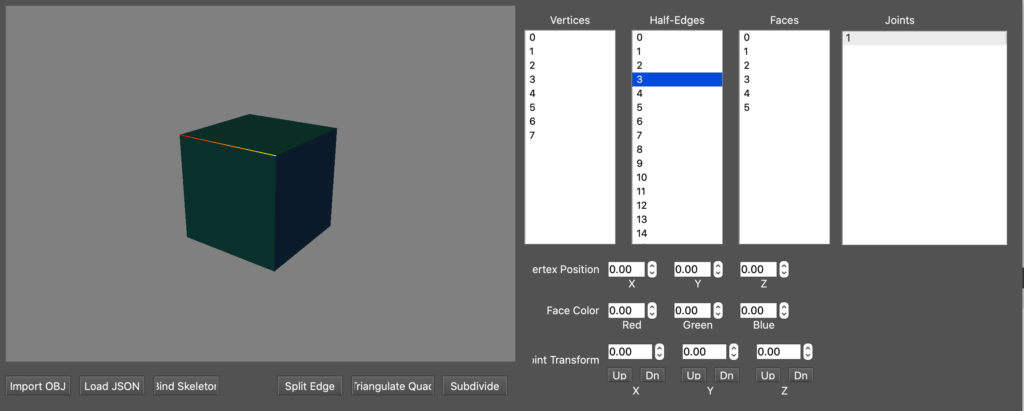
Subdivision and OBJ Editing
Split Edge
Splitting an edge refers to the process of selecting an edge that will be divided exactly in half, creating a new vertex in the process. The design involved with implementing this predominantly involves editing the pointers of incident vertices, edges, and faces so that the axioms of the data structure is maintained
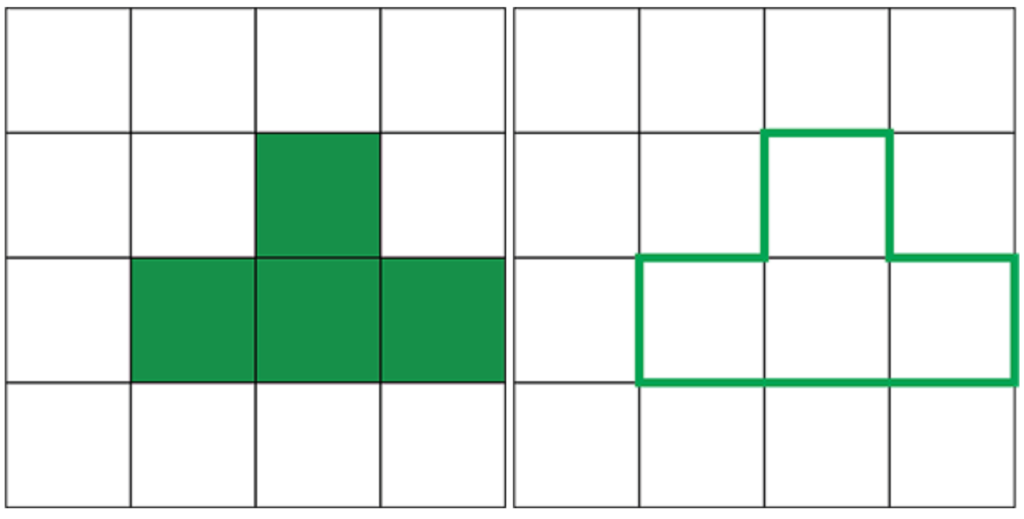
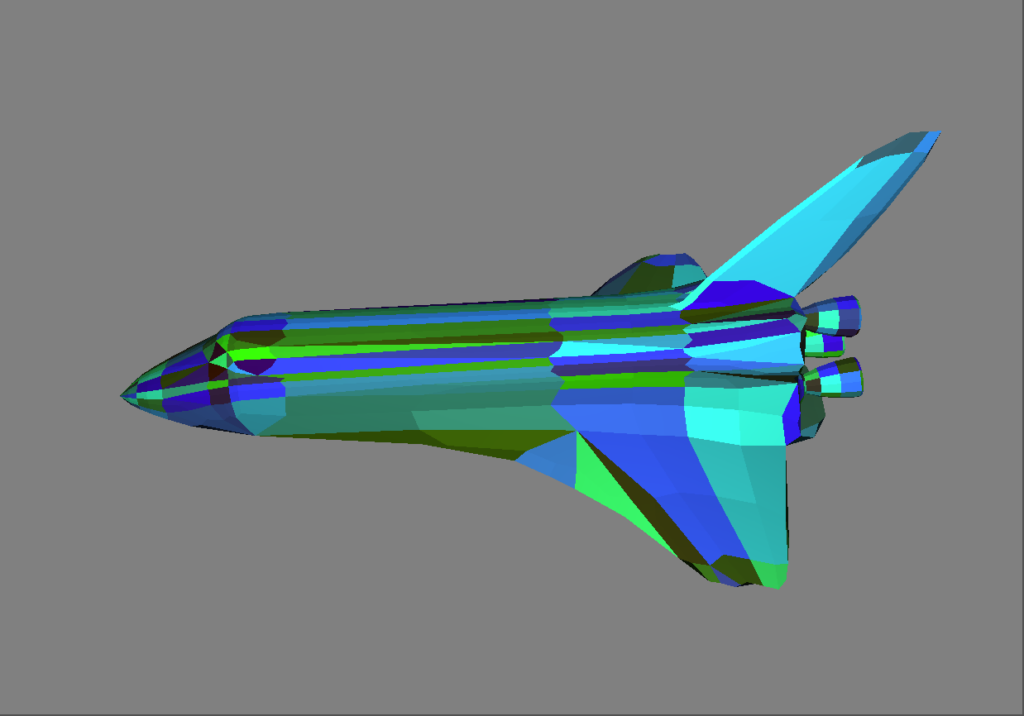
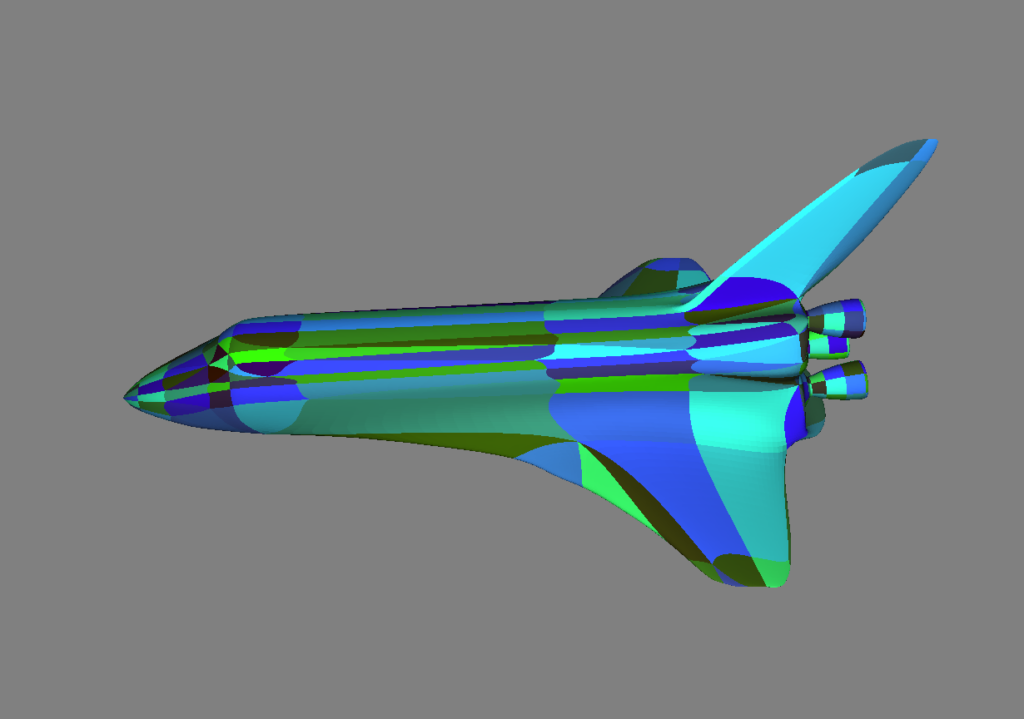
Catmull-Clark Subdivision
The Catmull-Clark Subdivision algorithm that I implemented is as follows:
- For every face calculate the centroid, the average position of all its vertices
- For every edge compute the smoothed midpoint, in the simple case this is the mean of the faces and vertices incident on an edge
- Recalculate the vertices positions by v’=(n-2)v/n + sum(e)/n/n + sum(f)/n/n
- For every face, split into N sub-faces where N is the number of vertices that it contains
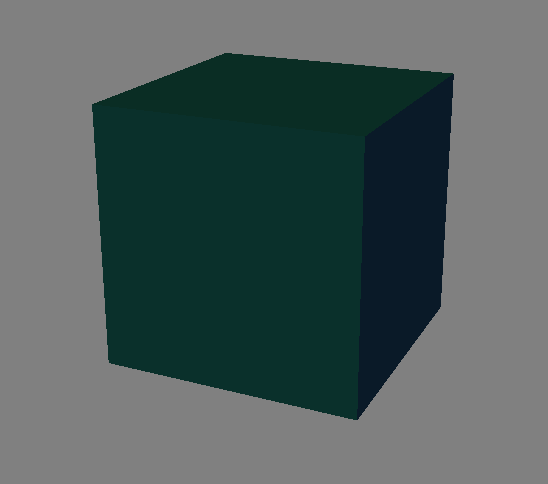
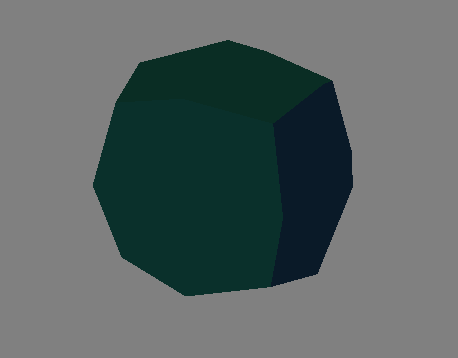
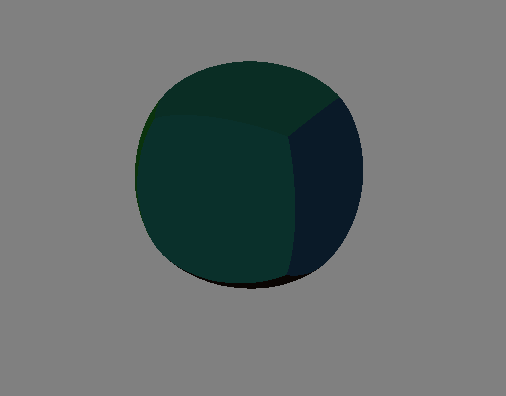
The two examples to the right demonstrate the process of subdivision over one iteration and over many iterations. Note that this process can iteratively continue indefinitely and will not be bottlenecked until the space to store vertices, edges, and faces grows too large.
Quadrangle Triangulation
All four-sided figures can intuitively be split into two three-sided figures which many serve different purposes including rasterization efficiency, etc. I implemented the following algorithm in order to do this and maintain the data structures properties:
- Create two new half edges which I will name HE_A and HE_B
- Create a new face which I will name FACE2
- Set the appropriate pointers (there are 4 that must be changed)
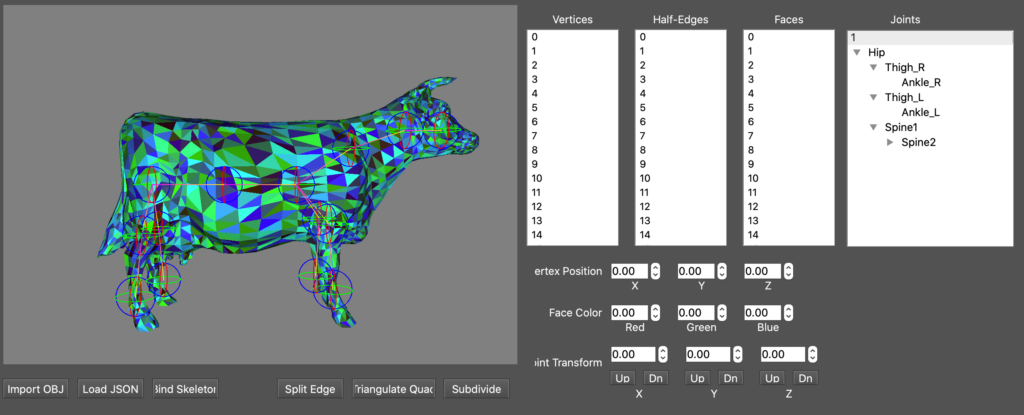
Skeletons and Skinning
Coupled with every OBJ file that creates a mesh there can be a JSON file that has its corresponding skeleton, a set of connected joints that have the capability to move each other. This is the same idea for how robotic arms are able to navigate at a specific angle to a specific point using nth degree kinematics. Similar to a tree in Graph Theory there exists a singular ‘root’ joint and all of its descendants in a many-to-one child-parent relationship. In this vein, the leaves of this graph are the joints that do not affect the movement of others and can therefore freely move without changing the skeleton as a whole.
After the JSON is loaded in it must be explicitly bound with the ‘Bind Skeleton’ button seen at the bottom of the GUI. What happens here is that each of the vertices are connected to the nearest joints and therefore have a change in position whenever the skeleton is moved. In order to account for vertices that are affected by more than one joint there must be a way to aggregate the joints influences together for every vertex. A naive solution to this is to find the N closest joints and assign each weight to be 1-(dist_from_vert/summed_dist_from_vert), however this fails to guarantee mesh connectivity.
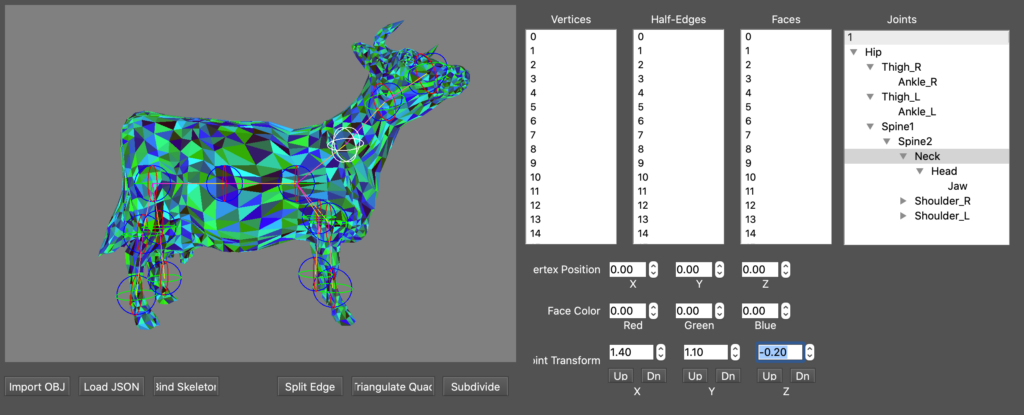
The implemented algorithm to assign weights treats the assignments like a heat-map and is as follows:
- For every joint find the closest vertex and use this distance as a minimum threshold for that joint, setting the influence of the joint as 1.0
- For all vertices connected to the original set of vertices, set their influence for this joint as a function of their distance from vertices with an influence weight > 0
- Repeat for all non-visited vertices adjacent to the just-visited vertices.
- Stop influence diffusion once the weight of the current iteration is below a certain threshold
- Repeat for all children of the current bone.
- After weighting all vertices, normalize their weights
Note that to the right we can see how a rotated skeleton moves the mesh. For a more intricate example please refer to the above video.
RoboCup
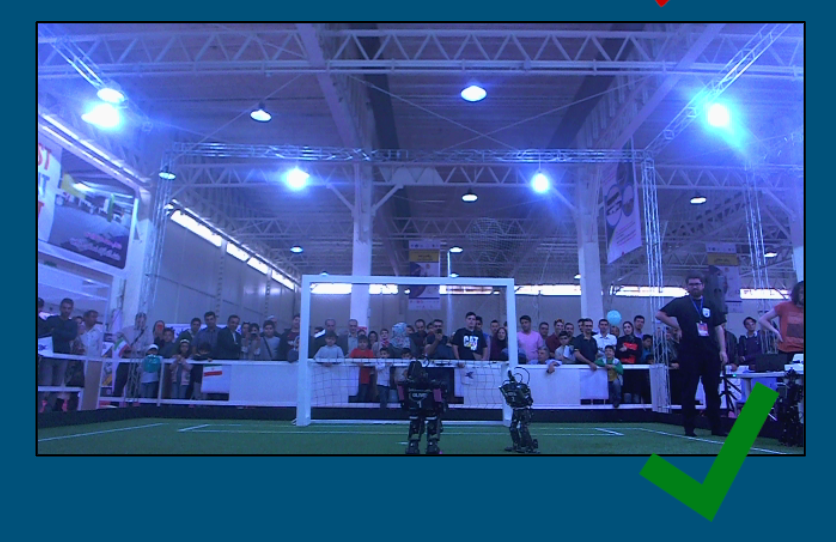
I serve as the current Head of Computer Vision of the UPennalizers RoboCup team where I manage the perception aspects of the robot as well as integration with both the mechanical and behavioral teams. We recently qualified for the RoboCup competition in Bangkok, Thailand that is set to take place in July of 2022.
Within the team, I have worked on several projects including the use of a Lua Torch neural network in order to recognize goalposts. I was able to improve the accuracy of this from the mid 60 percentages when we were using an OpenCV (classical) approach to a consistently high 90’s percentage. Before the competition I aim to extend this approach to recognizing other robots, having better ball detection, and furthering the general vision of our Robot
To the right is a video summation of our team as it was two years ago. Competition footage is included.
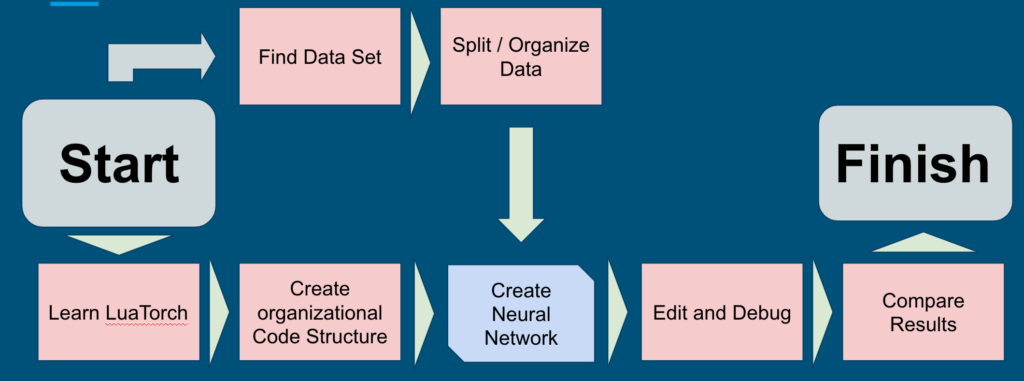
Goalline Post Detection
As described above, the purpose of this “Goal Post Detection” project is to identify which images contained a goal post so that the robot can change its current movement trajectory accordingly. Note that this was my project in the field of Machine Learning and was completed in the Winter of my Freshman Year. This project predominantly served as an introduction into the world of Computer Vision and A.I. for me and led to me taking a “Big Data” and “Computer Vision” and “Machine Learning” course later on.
The diagram to the write shows the general progression of the neural network construction. As noted, this project was completed using LuaTorch and was ultimately presented at a symposium for the donors to the program.
Java-Swing Game
Built a Java Swing application spin off from the typical arcade games. The game served as an introduction to building within a larger object oriented paradigm. The simplified class structure is as follows:
- Circle class is abstract and inherits from GameObj with fields for position, velocity, acceleration, and key methods including an overridden draw
- Game class implements Runnable and contains the majority of the logic for the game. This is where player I/O is handled, the panels and layout is determined, event handlers are defined, player information is stored, etc.
- GameCourt class extends JPanel and contains many fields capturing the snake, circles, lines, court parameters, etc. as well as the actions that occur with the games tick() function and the Mouse listener events
- GameObj class is abstract and contains the structure for which all game objects will implement. It contains several key functions for calculating intersections.
- LargerCircle and SmallerCircle classes are used to differentiate between the Red ‘killer’ circles and the Yellow ‘damage’ circles. Both extend the Circle class
- ScoreBoard class extends JComponent and overriders the paint for setting the score and listing names and contains several subclasses within the file.
- Snake class holds the field of a LinkedList of squares and sets the initial conditions for the snake object.
- Square class extends GameObj and contains the information / specifics that is needed to draw the “number of lives” squares in the bottom right of the screen.
Things to add:
- NFT homeworks (specifically the voting decentralized application and the NFT)
- J Compiler Homework (The final project for CIS 240)
- Summer Research on Permutation Networks